The dynamic new way to ensure your data translates to insight: Lytics Reports
December 7, 2022

For marketers, visualizing customer data is a critical and necessary component of truly understanding both prospective and existing customers. And it makes sense why. Research shows that on a neurological level, 90% of the information transmitted to our brains is visual. We use as much as 50% of our brains when processing visual stimuli. And, on average, people who follow directions that include illustrations and visual aids perform 323% better than those who follow text-only directions.
As humans, we are visually-inclined learners and visually-inspired doers.
Investing in data visualization, but also in business intelligence (BI) and reporting analytics tooling more broadly, can have lucrative implications for organizations’ decisioning capabilities and business agility. This goes beyond just arming marketers with more intuitive ways to glean insights from the data they’re gathering. More and more, organizations are recognizing the value of clear, actionable data-driven insights, and are putting their dollars where their goals are.
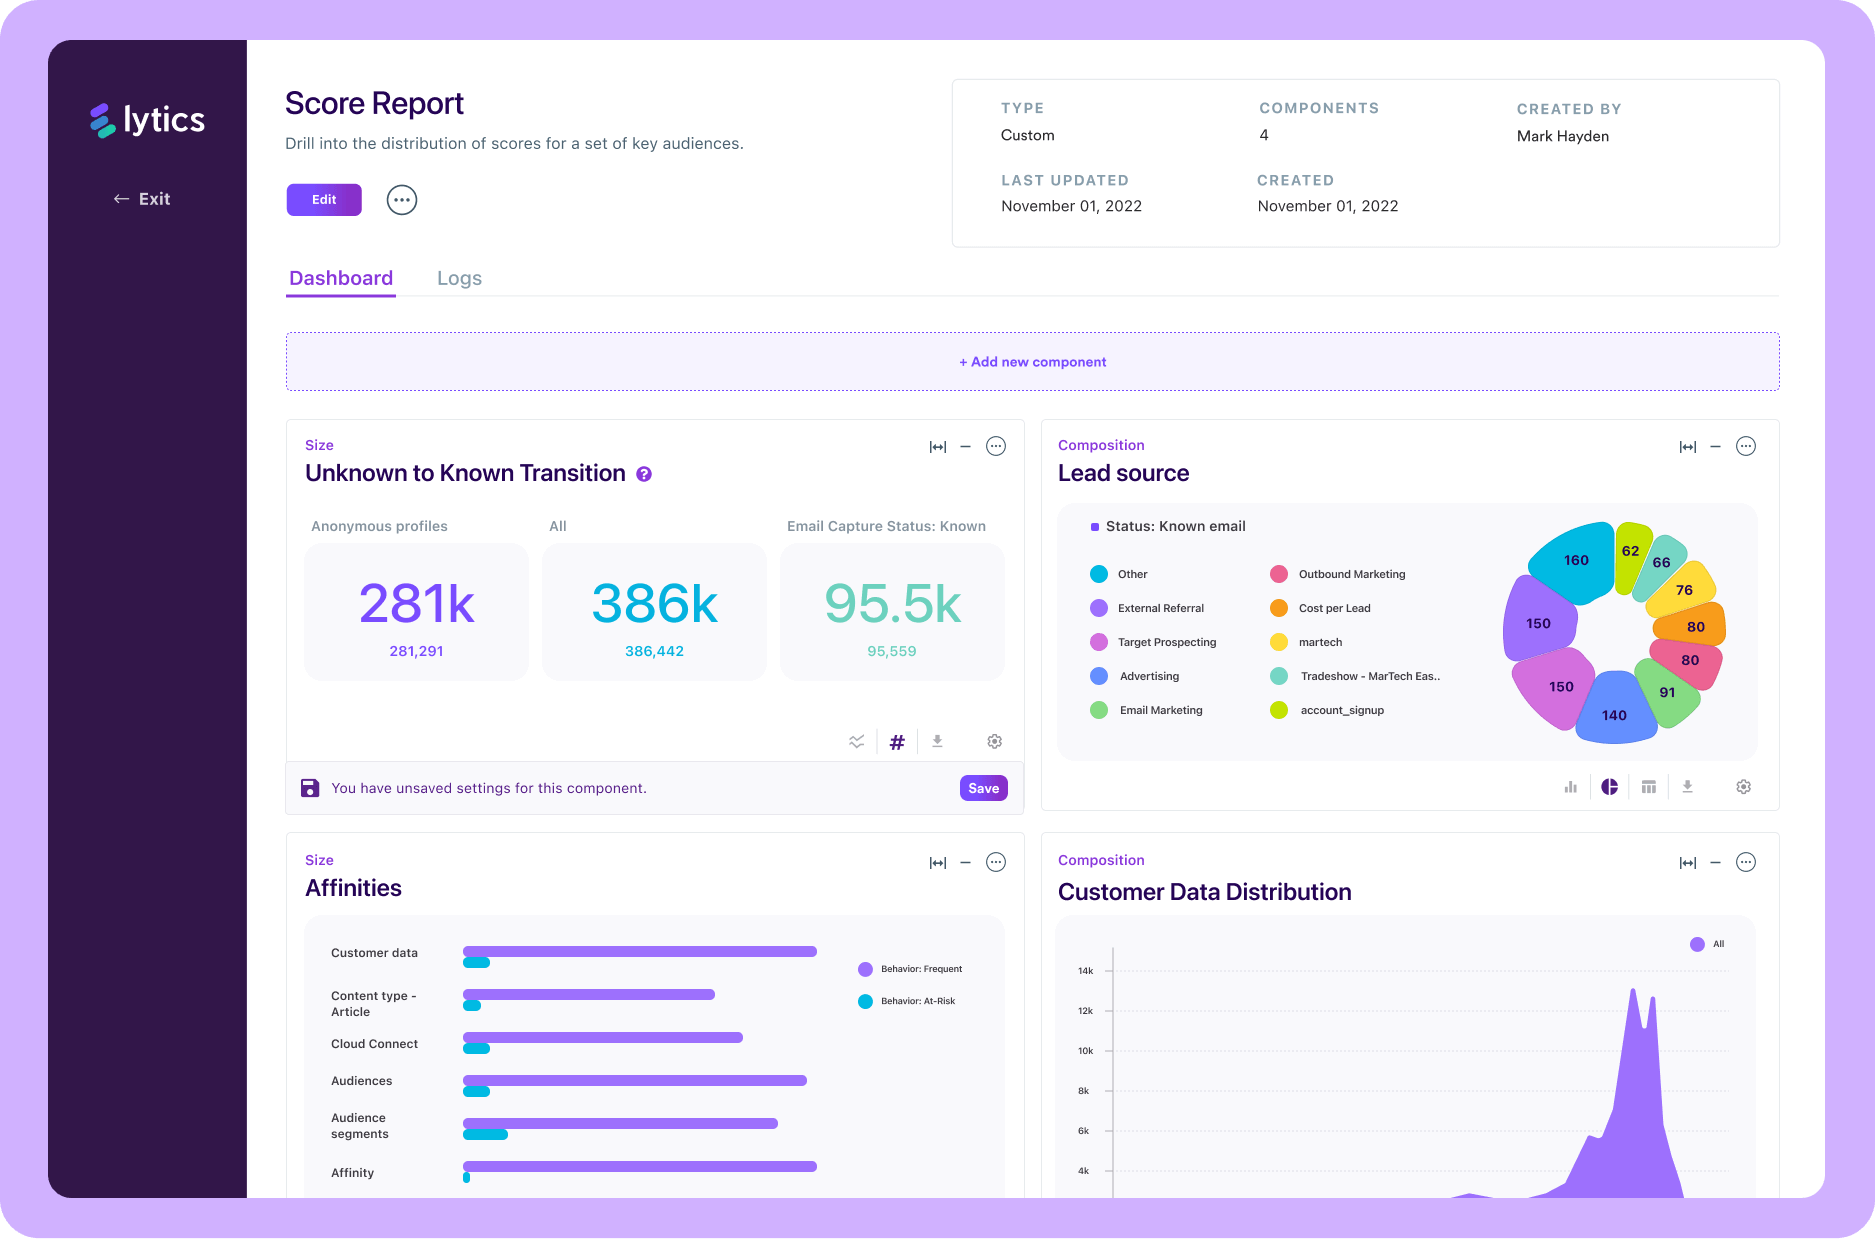
Lytics Reports —now more user-friendly than ever, intuitive, and highly configurable — includes capabilities for audience-level, profile-level, content-level and lookalike model-specific reporting. But before we explore the capabilities for reporting within Lytics in full, let’s zoom out and dive into what’s going on in the market at large.
What does the data visualization market look like in 2022?
The data visualization market alone is expected to reach $19.2 billion by 2027 (up more than 125% over its $8.85 billion valuation in 2019). Clearly, the ability to run intuitive marketing reports and to analyze and visualize data in order to uncover actionable next steps, is valuable in a way that cannot be understated. It allows marketers and business leaders alike to understand the efficacy of their marketing initiatives and ways of working, and to take simple data points and turn them into chapters of a complete story about customer behavior and business efficiency.
Here’s how it can supercharge your business.
The ROI of data visualization, marketing analytics, and business intelligence
Data visualization and user-friendly reporting functionality, when it comes to marketing and business analytics, can mean the ability to:
- Accurately and meaningfully measure marketing efficacy at varying levels of depth,
- Foster a deeper customer understanding,
- And glean clear, actionable insights from your data.
It allows for a CMO, for example, to explore the big picture (i.e. overall marketing ROI or channel performance as it relates to budget allocation) and a performance marketer, on the other hand, to explore more detailed campaign and ad-level data, with a particular focus on uncovering optimization opportunities.
But there are also some very tangible, quantifiable advantages:
- Those visualizing data and insights are 3x more likely to execute decisions as intended, and 5x more likely to make decisions much faster than market peers.
- The use of data visualizations could shorten business meetings by 24%, which is particularly critical when presenting reports to busy executives or board members.
- Managers in organizations with visual data analysis tools are more likely to find timely information, and 48% of them can find the data they need without the help of IT staff.
- Companies with advanced analytics capabilities are 2x more likely to be in the top quartile of financial performance within their industries.
But even with an understanding of how and why accurate, clear reporting and data visualization matters, it still begs the question — how do you get it right?
The answer is threefold. First, know what your goals are for using your data (you probably already do). Then, invest in the right technology to do so, and focus your use of that technology on achieving those goals.
Ensuring your data translates to insight — with Lytics Reports
By breaking down data into digestible charts and graphics, marketers can unearth insights, analyze their campaign efforts and audiences, and ultimately improve their tactics. Using Lytics Reports, marketers can, for example, explore user demographics between audiences, track the sizes of audiences used in A/B tests, and validate their data.
What long-standing problem are we solving with Reports?
Historically, popular analytics platforms such as Domo, Tableau, and Power BI have allowed for technical and non-technical marketers to create powerful dashboards. However, using these platforms has often come with unforeseen challenges, including:
- Connecting to an external database, which can lead to data governance, data staleness, and ETL related concerns.
- The inability for marketers to liberate the data and insights that live in BI platforms.
While traditional dashboard and analytics tools can be used to create robust charts and analytics, Lytics’ Reports provides a similar suite of capabilities, without the need to export data, or worry about any of those data governance and/or staleness issues.
Why choose Lytics Reports?
Lytics Reports is an easy-to-use tool for creating powerful dashboards that empower marketers and marketing analysts, built on top of our industry-leading customer data platform (CDP). With hundreds of integrations and ways to ingest data, Lytics Reports can be built using any connected data source — now with a new UI.

All this means that within minutes of ingesting data, marketers can create powerful reports that update in near real-time, putting the power of data-driven insights directly in our customer’s hands by allowing them to build custom reports precisely to their specifications.
- By promoting data exploration, Lytics Reports ensures a direct path for answering critical questions while also providing a highly consumable platform for surfacing many of our platform’s differentiators — such as Lytics Behavioral Scores and Content Affinity.
- Lytics Reports can help visualize the effectiveness of A/B testing campaigns, validate data for an audience, compare users between audiences, and identify trends across users.
How to get started with Lytics Reports today
To get started, sign up for a free trial of Lytics Decision Engine, or check out the technical documentation that dives deeper into the potential of our Reports capabilities.


