
Understand the engagement of your most important segments.
Create a Lytics Report to uncover helpful insights using Lytics' 9 out-of-the-box Behavioral Scores.
Given the sheer amount of activity data available and the complexity of cross-channel engagement, it is easy to struggle to understand your users effectively. Traditional analysis can be resource-intensive and doesn’t always translate into actionable insights.
How can Lytics help?

Automatic scoring based on user activity.
Lytics Behavioral Scores provide granular insights into user interactions in the form of nine distinct behavioral scores that represent different aspects of user engagement: Consistency, Frequency, Intensity, Maturity, Momentum, Propensity, Quantity, Recency, and Volatility. Because these scores are stored on a profile as attributes, they have the same functionality as any of your other profile attributes. You can use them to create audiences, inform lookalike models, and visualize them in Reports.
Easy data visualization for insight discovery.
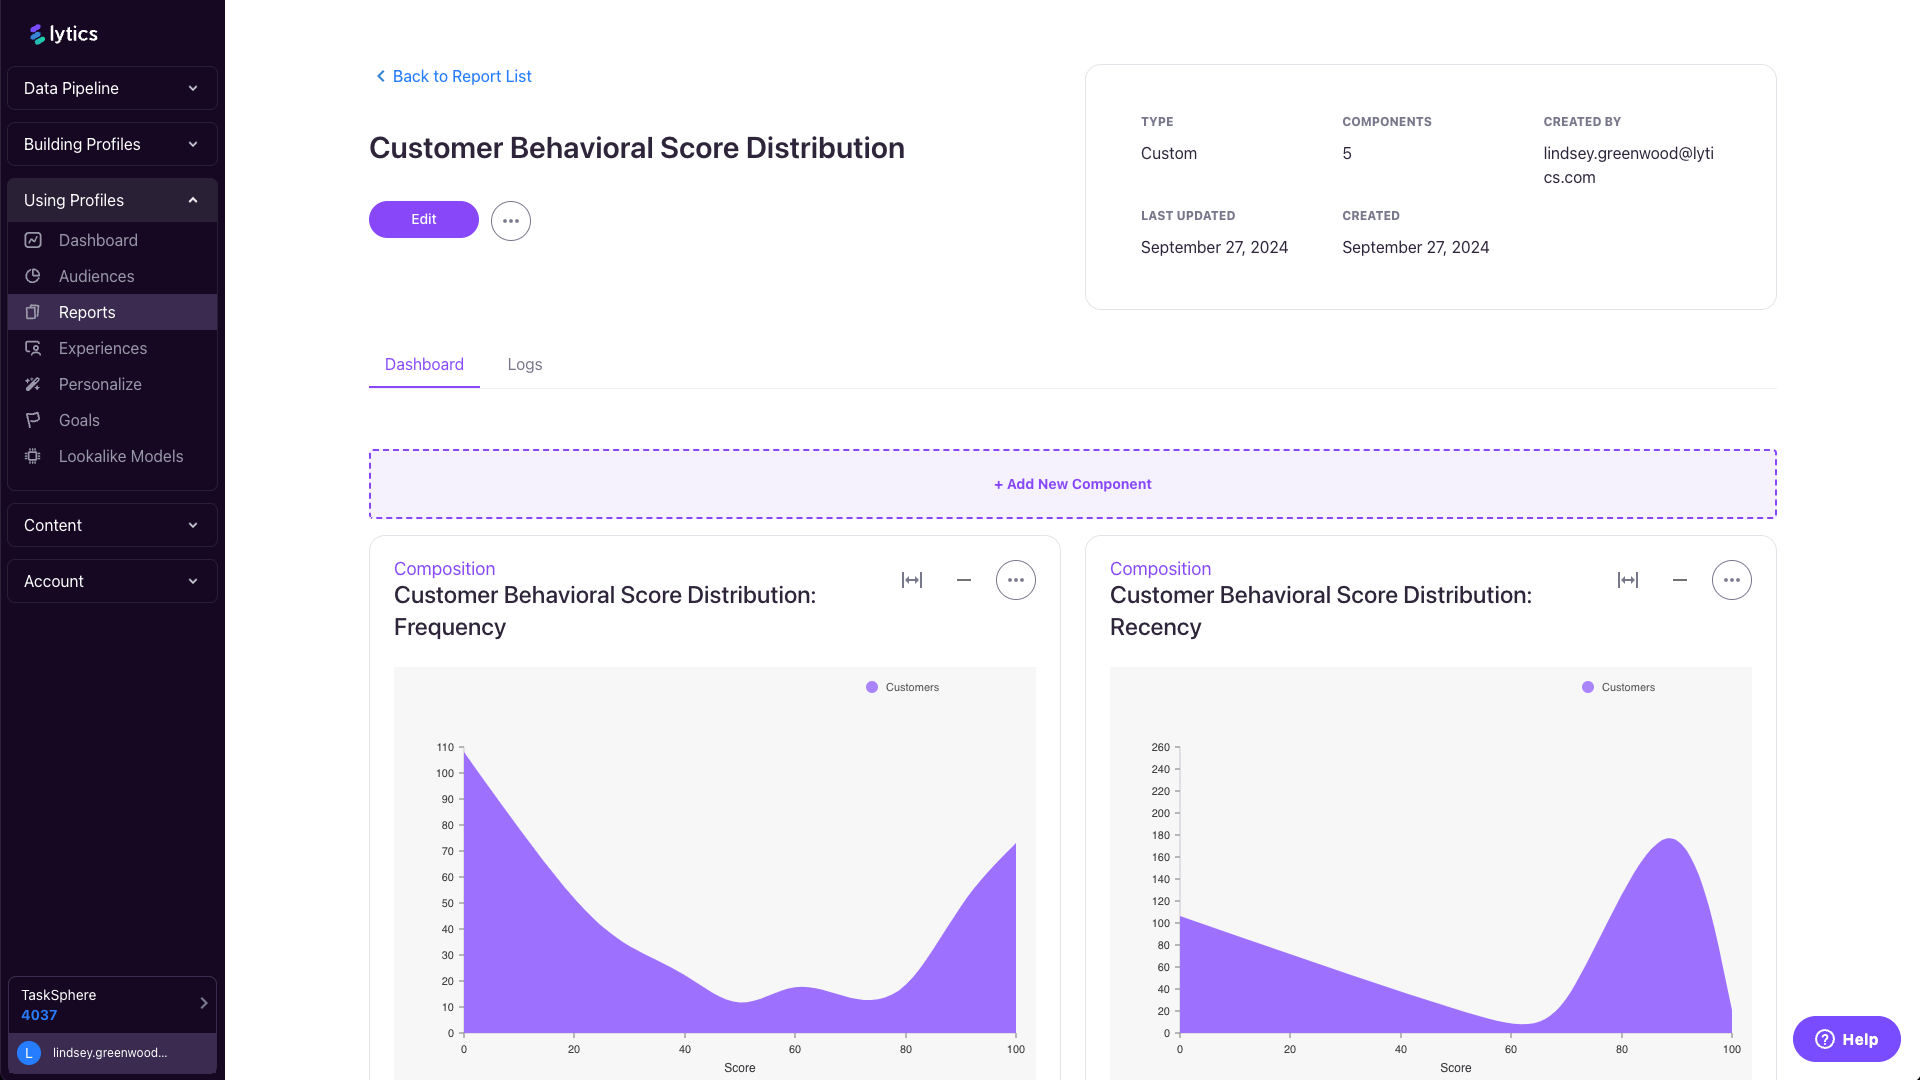
In creating a strategic dashboard with Lytics Reports, you can visualize the distribution of behavioral scores of your most important audiences, enabling you to understand how the users that make up these audiences engage. With these insights, you can tailor your marketing strategies to better resonate with your top customers, optimize their experiences, and ultimately drive greater loyalty and revenue for your business.
Prerequisites
To activate this use case, you will need to have:

Access to an active Lytics account.
Create one for free here.
The Lytics JavaScript Tag installed on your site.
Learn how to install the tag here.
The desired segment in Lytics.
Consider using one of our pre-built segments or build your own.
Level of effort Low
Let's get started
1
Determine what audience you would like to understand better. Lytics Report components start with an audience, so you’ll first want to decide which audience you want to analyze. You can choose an out-of-the-box Lytics audience or a custom segment built within your Lytics account.
Some audiences of interest might be prospects, existing customers, recent purchasers, email subscribers, and more. Keep in mind that these should be users likely to have been interacting with activity-based streams coming into Lytics, like your default web stream, so that they have a score associated with their behavioral activity.
2
Familiarize yourself with Lytics Behavioral Scores. In order to build the most useful Lytics Report and interpret the data it visualizes, you will want to review Lytics’ documentation on Behavioral Scores. For example, perhaps you’re most interested in how often specific cohorts of users interact with your brand. It would be helpful to know that the Lytics’ Frequency score is a score that is based on a user’s frequency of interaction comparatively to all other scored users.
3
Open Reports in the Lytics app. Navigate to the Using Profiles section of your Lytics account and select Reports. In this Reports section, you will find your pre-existing Dashboard report (this is the report that is displayed by default in your Using Profiles Dashboard tab) and the option to create new Reports.
4
Create and name a new report. Once you click Create Report, you’ll be taken to the Report wizard, where you will be asked to to name your Report a name and description. There is also an option to set your report as private, but if you wish to share this with other users, you can leave this option unchecked.
5
Create and configure a Composition component. In your newly created report, you can immediately start adding components. There are multiple types of components, but in order to understand the distribution of values for a specific profile attribute, you will select the Composition option. You can now configure it with the Name, Description, Audience(s), and Field you want to visualize. All of the Lytics Behavioral Score fields start with “score_”, so they are easy to find. Select one of these scores that is of the most interest to you.
6
Duplicate and update. Once you’ve got your first component created, it’s easy to add similar components to the report. Simply duplicate the existing composition component, and within the settings, you can select a different Behavioral Score you’d like to visualize in your report.