How to use customer experience insights for improved business performance
June 1, 2023

According to an Esteban Kolsky study, 72% of customers will share a positive brand experience with six or more people. And this is the true power of a good customer experience. It’s the foundation of brand loyalty and customer retention.
The only problem we see is that most businesses aren’t measuring their customer’s experiences, thus, not gathering meaningful insights from it. And you know what they say, what isn’t measured cannot be improved. So if you want to build a base of loyal customers who obsess over your brand and always tell their friends and family about you, you need to draw a line between customer analytics and action.
Below, we’ll show you how you can convert customer experience data into insights and use these insights to improve business performance.
Understanding the customer journey
Before measuring customer experience insights, you want to understand the customer journey because it’ll allow you to collect data from all the interactions along this journey.
The best way to understand the customer journey is through touchpoint mapping, as it’ll help visualize all the touchpoints your customers use to interact with your brand. From here, you can gather data from each one of these touchpoints.
So start by identifying key touchpoints and separating them into five categories:
- Awareness (Social media ads, blog posts, word of mouth)
- Interest (Product descriptions, about us pages)
- Purchase (Pricing pages, account creation)
- Experience (Help center, customer support, FAQ page)
- Loyalty (Subscription renewal page)
Gathering customer experience insights
Once you have a rough idea of your customer journey, it’s time to collect data at each stage:
- Website and app analytics – Awareness stage
- Social media monitoring – Interest stage
- Contact center data – Purchase stage
- Customer reviews and ratings – Experience stage
- Surveys and feedback form – Loyalty stage
Website and app analytics – Awareness stage
Monitoring your website and app analytics is a must since it’ll help you understand where your prospects are coming from and how they are learning about your brand. Is it through blog posts, social media posts, or Google Ads?
Social media monitoring – Interest stage
Monitoring social media discussions is an effective way to gauge your audience’s interest levels. You’ll learn which mode of communication interests prospects the most, whether it’s educational social media posts, infographics, or case studies.
Contact center data – Purchase stage
Analyzing customer service and customer success calls is one of the best ways to locate weaknesses during the purchase stage. You’ll find out what features your customers are struggling with, and you can focus on solving these problems before they get to your customer support agents.
Customer reviews and ratings – Experience stage
A more “passive” way of gathering customer experience insights is reading your Google reviews. You can learn about a customer’s experience with your brand and filter by lowest rating to see what your customers are complaining about the most.
Surveys and feedback forms – Loyalty stage
Surveying customers is always your best bet when you want to collect qualitative data as you can create and customize questions around what you’re looking for.
Analyzing CX data: Tools and techniques
After you’ve mapped out the customer journey and gathered data at every touchpoint, it’s time to conduct customer feedback analysis. This often involves:
- Looking at customer satisfaction survey results
- Identifying customer churn rates and reasons
- Uncovering patterns in customer support tickets
However, reviewing a bunch of quantitative and qualitative data can be boring. So consider implementing these methods to make your data points easier to understand:
Text and sentiment analysis
You probably have better things to do than read through thousands of customer surveys. So if you want to automate this process, opt for sentiment analysis software.
Sentiment analysis uses natural language processing to understand if text contains negative, positive, or neutral emotions. This gives you an idea of a customer’s opinion of your brand without reading through every survey answer.
Data visualization
Data visualization tools convert boring numbers into tables, graphs, and pie charts that are easy to understand.
Instead of looking at random KPIs and customer ratings, use data visualization to turn data into insights.
Statistical analysis
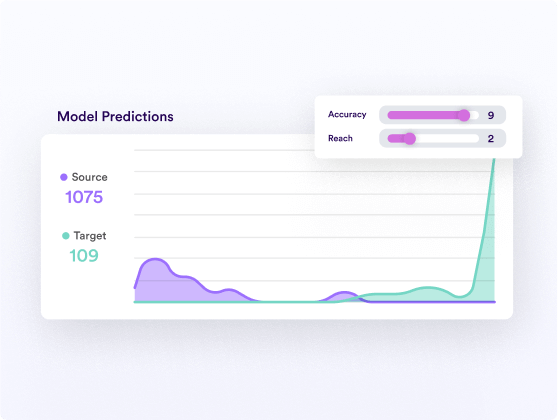
Statistical analysis uses AI (Artificial Intelligence) to discover patterns inside your quantitative data. For example, if your customers’ surveys are showing low ratings for your email newsletter experience, statistical analysis will make these patterns easy to find.
Customer segmentation
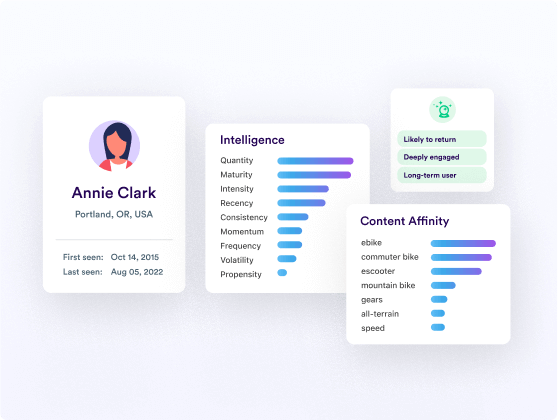
Customer segmentation software will segment your customers into different groups, depending on demographic, psychographic, geographic, and behavioral data. You can then utilize personalization strategies to appeal to different audiences.
How Lytics help with CX data collection
The Lytics CDP (Customer Data Platform) collects data from multiple data sources, such as Google Analytics, Facebook Ads, Google Ads, and Shopify, and combines them inside unified customer profiles. It does this using advanced identity resolution matching so you can get a 360-degree view of each customer’s experience. It doesn’t matter if you’re collecting data from your email, mobile app, website, or survey tool. Lytics will combine all the data so it’s easy to understand; say goodbye to dealing with scattered and hard-to-understand data points.
How to use CX insights for business success
Once you’ve unified and structured your data under one digital roof, use it to improve business performance. For example, you can do this by:
- Identifying the pain points of customers
- Introducing or removing features based on customer feedback
- Boosting customer retention and loyalty
- Personalizing interactions with your brand
- Aligning customer experience insights with organizational goals
Unlock customer experience insights with Lytics
Customer experience insights tailor marketing and product development around an individual customer’s needs. This allows you to build a more personalized experience, improving retention rates and customer loyalty. If you’re interested in unlocking customer experience insights, consider Lytics.
The Lytics CDP will collect customer data from various touchpoints, so you can build a customer journey map. From here, convert your boring data into tables, graphs, and infographics so it’s easy to understand. Lytics also uses customer segmentation techniques to build individual customer profiles, helping you gain a 360 degree view of your customer journey analytics.