What is a graph database? The role of graphs in data analysis
April 26, 2022

Datasets nowadays are more intertwined than ever before. Gone are the days when data was relegated to its respective silos and segmented from other data points. This makes graph databases an essential tool for exploring the intersecting relationships between incoming information. So, what is a graph database and why is it relevant for developers and marketers alike?
What is a graph database?
A graph database is a digital warehouse that stores data and configures the information into graphs. This goes beyond the conventional bar, chart, and pie graphs. More specifically, it includes graphs that use nodes and connecting lines to display the relationships between varying data points. This is known as an identity resolution and is an essential element in exploring how data sources come together to form a cohesive “story.”
What is a graph database used for?
Graph databases are used across industries and departments within industries. They’re applicable in any instance that requires data collection and metric analysis. This primarily includes customer data, such as website visits, social media activity, and email open rates. However, it may also include product-related data that’s presented and analyzed during scrum meetings. Likewise, a cyber-security department may use graph databases to detect threat vectors and formulate fraud prevention plans.
How a graph database works
Graph databases reveal the intricate connection between data sets. This is a pivotal point that more conventional bar, table, and pie graphs may not be able to convey.
Look at the two table graphs below:
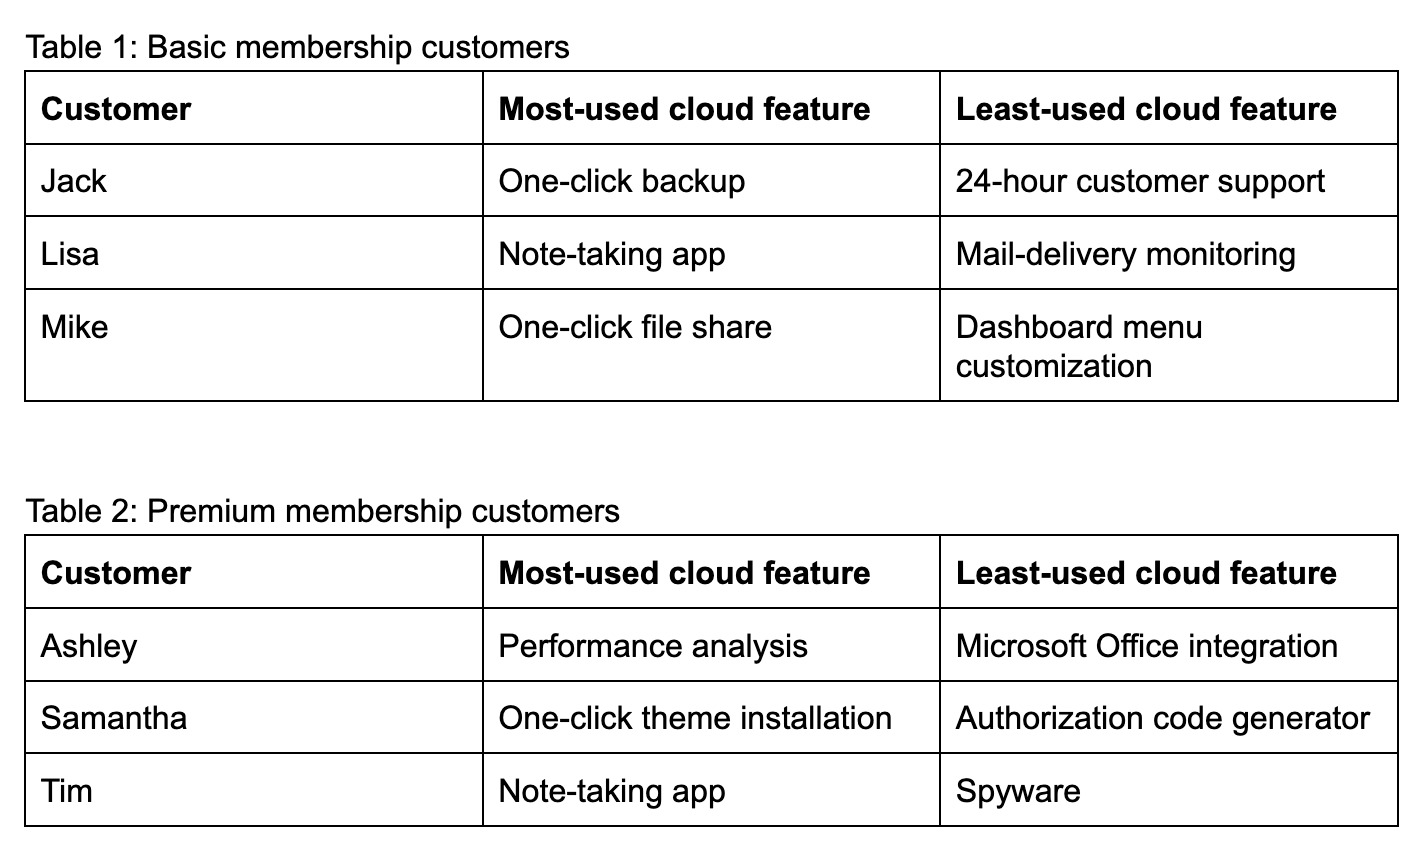
The two separate tables show the most- and least-used features in a cloud service among basic and premium members.
Here’s a question: Which members mostly use the note-taking app?
If you look at the two tables, it’s quite easy to see that it’s Lisa (basic member) and Tim (premium member) who favor the note-taking app. However, what if there were additional tables, perhaps one representing trial members and another for VIP members? Moreover, what if each table had 50 members? It now becomes much harder to determine which members share commonalities.
Each table is also a separate data set, making it harder to cross-reference information between tables. Do you see how this is an insufficient way of analyzing data?
Here’s a more efficient way with a graph database:
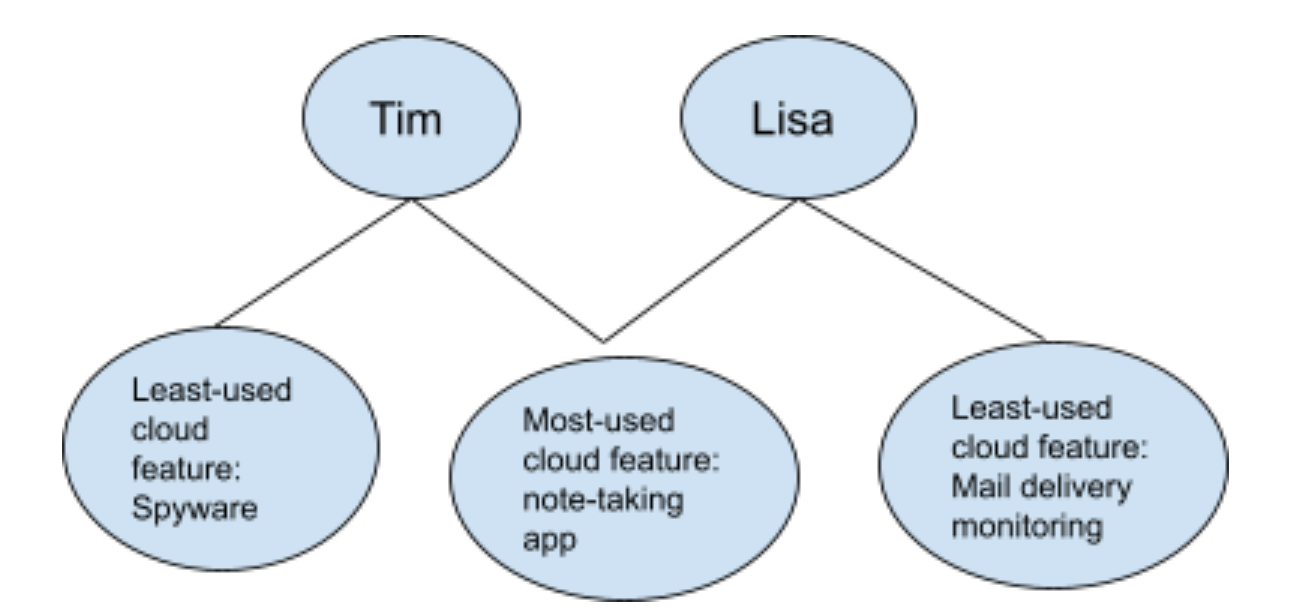
Each oval is a node that represents a data point. Here, it’s immediately clear that Tim and Lisa share a commonality: They both predominantly use the note-taking app. There are also features Tim and Lisa seldom use. However, these features, or data points, are distinct and not interconnected in the way the note-taking app is interconnected through Tim and Lisa.
Graph databases can get far more complex with dozens upon dozens of interconnected nodes that form a web-like network. Even if this is the case, the graph database will always plot the data points in a way that’s easily decipherable.
Why use a graph database?
A graph database enables developers, marketers, and sales reps to handle and quantify large volumes of data efficiently. The graphs show the compiled data and how the different data sets correlate or intersect. It provides an easy way to review and interpret complex data structures. In other words, it takes a sophisticated data model and simplifies it.
The database evolves with your company
As your business grows, it may take on new data sets and discard old ones. For example, if you add an affiliate program, new data may include performance metrics from affiliate referrals. At the same time, you may delete data from promotional social media campaigns of old product launches. Graph databases are capable of handling data changes with minimal manual input.
Get a bird’s eye view
Get a broader overview of trends as they occur in real time. Perform a simple keyword search query in the database to acquire the data you need—fully graphed and plotted for you in just seconds.
Create in-depth customer profiles
Use a graph database to chart customer profiles. Create identity graphs to find common traits and actions among high-profile customers. Once you have this information, you can personalize your marketing to take them farther along the sales funnel.
Integrate your data silos with Lytics
Manage your data sources with Lytics’ Cloud Connect. We make it intuitive to sort, customize, and understand your data sources through a system your team can start using today. Take the guesswork out of data analysis by trying Lytics free for 30 days.