What’s data aggregation and why does it matter for business?
July 27, 2022

Whether you serve B2C or B2B consumers, you need data. Just as importantly, the data needs to be in a format that’s easily decipherable to human readers. This is where data aggregation comes in—it’s a necessary component for businesses to remain competitive in their given industry.
Data aggregation defined
Data aggregation is the collection of raw data that’s converted into a summarizable format. By summarizable, we mean an easily readable form, such as numbers organized in an Excel sheet, charts, or graphs. Even infographics are a form of data aggregation.
How does data aggregation work?
If you have data aggregation software, then the system handles the process without the user really needing to understand what goes on behind the scenes. However, the process more or less includes the following steps.
- Data extraction: The software pulls the data from the data sets you specify
- Data transformation: The software converts the raw data into a format suitable for human observation and interpretation.
- Data analysis: The software compiles the data into a summarizable form. If you use Google Analytics, the dashboard that shows the data through graphs, charts, and scatter plots is a prime example of aggregated data converted into a summarizable format.
Why data aggregation matters
Data aggregation helps companies make informed, consumer-based decisions. It helps HR, marketing, and sales departments understand their customers, their behaviors, purchase patterns, pain points, etc. With aggregated data, companies can create personalized and more effective sales funnels that convert.
Data aggregation benefits
- Extract only the data you need for aggregation. Not all data will be of use. You get to choose the data that’s relevant for your analysis.
- Aggregate data from a small data set, such as high-value customers. Use the data to create highly personalized customer journeys.
- Aggregate data from first-party data sources to stay competitive
- Create comprehensive reports from aggregated data and present them to investors and stakeholders.
Types of data aggregation
At the fundamental level, two main types of data aggregation exist: time aggregation and spatial aggregation.
Time aggregation
This represents a data source over a period of time. Examples include:
- Total email open rate over a 30-day period
- Quarterly earnings from a specific product or service
- Customer acquisition from affiliates over a calendar year
Spatial aggregation
This represents the information comprised of multiple data points.
An example is exploring and comparing the churn rate by gender, geolocation, income level, etc.
Data aggregation examples
The following are examples of data aggregation by industry.
Travel industry
In the travel industry, airlines and tourism agencies can aggregate data pertaining to customer behavior and booking patterns. Here are some scenarios:
- Aggregating data pertaining to travel packages and deals: How well do customers respond to specific airfare offers during peak and low travel seasons?
- The travel frequency of customers with airline credit cards: How much better is their lifetime value compared to non-airline credit card holders?
Finance industry
Banking and other financial institutions can examine customer data to determine the viability of their customers. These are a few examples:
- Data can determine the loan default rate of customers that fall within a credit score range. This helps lending institutions determine the risk of lending to certain demographic customers and the interest rates to apply.
- Data can determine which customers are most likely to apply for certain banking offers. Data may show that female millennials have a high rate of applying for cash-back credit cards, for example. Institutions can adjust their marketing accordingly to cater to this demographic.
Retail industry
Retail sectors can create an array of campaigns based on what their aggregated data reveals. Some instances may include:
- Using data for competitive price monitoring: Data can determine the optimal price range for a product to be profitable yet affordable to attract enough buyers over the competitor’s product.
- Aggregated data can determine products customers are likely to purchase based on their previous purchase or search history.
Manual data aggregation vs. automated data aggregation
You can aggregate data manually or automate the process using data aggregation software. If aggregating manually, you’ll likely do so using an Excel sheet and inputting the data into the individual cells one by one. The manual process will work for smaller businesses that don’t have a whole lot of data.
As you grow your business, the data will simply be too much to process manually. Sooner or later, you’ll need a program that can perform the aggregation in seconds and compile the raw data into your choice of graphs or charts with the click of a button.
Data aggregation automation has two major benefits: It saves you time and also eliminates human error. Even if your company is in the startup phase, you should begin investing in data aggregation software now for efficient data gathering and analysis.
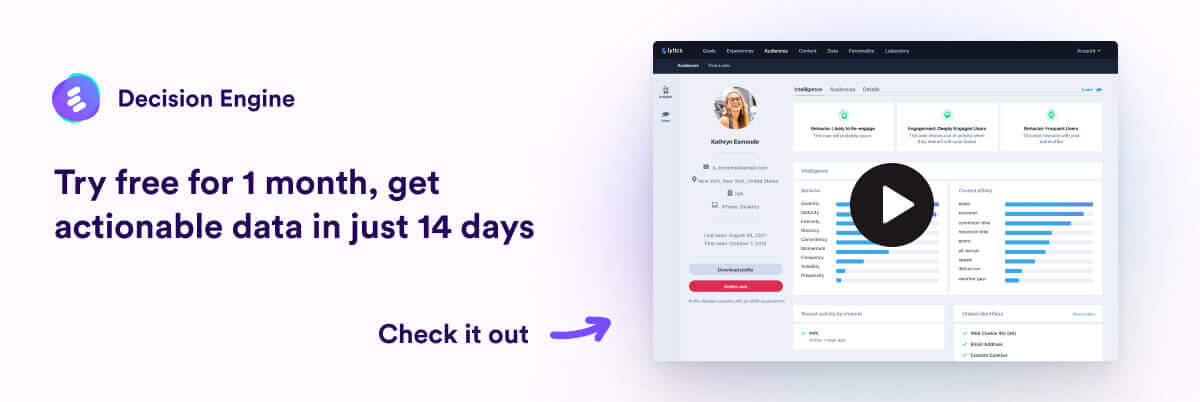
Automate data aggregation with Lytics
It’s clear that data aggregation automation is the way to go. Using Lytics’ Cloud Connect, you can easily consolidate your data and convert the raw information into summarizable content. With our aggregation solutions, quickly determine your customers’ mannerisms, attitudes, and conversion probability. Try Lytics for free today—get started with our free demo.